The 'Grid and Gantt' view shows the outline view of the WBS and the Gantt chart side-by-side.
To view the schedule in the grid and Gantt view
- Ensure that you are on the project schedule module. If not done already:
- Ensure that you are on the management console of the project
- Click the app launcher icon
 in the top-right and select 'Schedule'
 - Click 'Planner' on the top
- Choose 'Grid and Gantt' from the drop-down on the top left

An example is shown below:

See the previous section Grid View for descriptions of the filters and columns in the table.
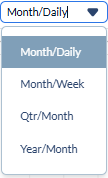
- Use the filter at the top to choose, Month/Dialy, Month/Week, Qtr/Month, Year/Month:
Month/Daily: Displays months along the top and breaks them down into individual days for detailed scheduling.
Month/Week: Shows each month divided into weeks, helping you track progress on a weekly basis.
Qtr/Month: Groups the timeline by quarters, with months shown within each quarter for a broader planning view.
Year/Month: Organizes the schedule by year, with each year broken down into months for a high-level overview.

The Gantt chart also allows you to set and modify the start and end dates of the items by simple drag-and-drop actions.
- You can also set the start and end dates for tasks in the Gantt view. Just drag and drop the bar representing an item near the required date range and drag the left and right edges of the bar to particular dates as required.
- You can directly modify the dates only for last-level child tasks, that is, the items that do not have any children. The dates for the parent tasks adjust automatically, depending on the change in the children's tasks.
- The start and end dates are shifted for the dependent tasks based on changes in the predecessor tasks and their dependency relationship.
- You cannot modify dates for published tasks.
See Create Schedule Status Line to know more about schedule status in grid & gantt view.
Search and filter options:
- Use the 'Search' box located at the top left to find any project using any value from the table as search criteria
- Right-click the column header and customize the display and order of the columns as you wish
- The options at the top right allow you to filter the entries, and manage personalized and customized views of the table. Use the links below to learn more about these:
View Groups and Subtotals
- You can get totals and subtotals of numerical data for any selected set of records by grouping and applying nested grouping. Use the
 icon at the top right to organize the data by column headers.
 - The system automatically aggregates relevant numerical values, giving a structured breakdown and a clear view of the grand total distribution. See Group and Organize Items in a List View for more details
Download as Excel Sheet
- Click the
 button at the top right to save a local copy of the list in Excel format for sharing and record-keeping. See Download List Views and Logs in Excel Format for more details.
Was this article helpful?
That’s Great!
Thank you for your feedback
Sorry! We couldn't be helpful
Thank you for your feedback
Feedback sent
We appreciate your effort and will try to fix the article