The Schedule Status Summary provides a consolidated view of task progress across all dates where status line markers have been added. It highlights planned vs. actual completion percentages, giving you a clear overview of how your schedule is progressing over time.
This summary helps you quickly identify patterns, track deviations, and evaluate overall project performance at a glance.
Use it alongside the Gantt view to gain both high-level insights and detailed task-level comparisons.
To view schedule status summary
Ensure that you are in the 'Schedule' module. If not,
- Click the main menu from the top left
- Click 'Schedule' under 'Scheduler'
- Click 'Status Line Summary' on the left
The project summary screen opens with the summary of tasks based on the most recently created status line marker.
- Click the dropdown at the top to view the summary for a different date where a status line marker has been created.
The upper pane shows the project summary:
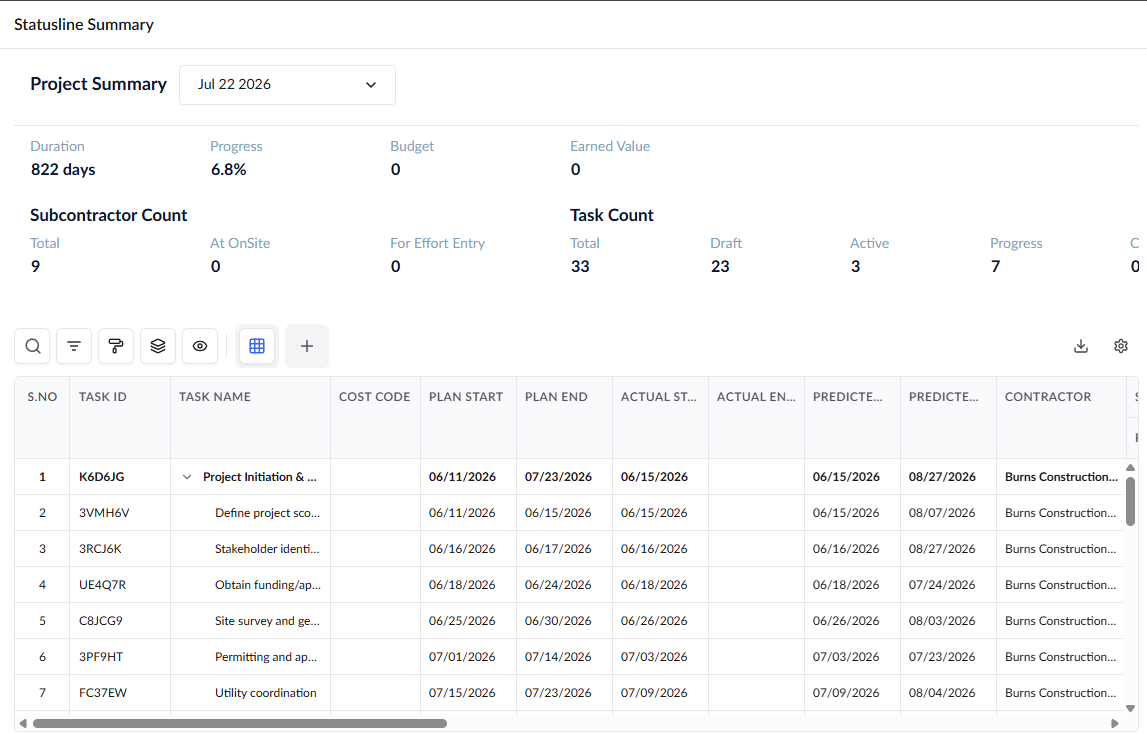
Duration – The total planned timeline of the project, calculated from the start date to the end date, excluding weekends and holidays
Progress – The overall percentage of project completion based on task progress, as of the status date.
Budget – The cumulative amount of funds allocated to scheduled tasks from the project budget, up to the selected status line date
Earned Value – The monetary value of work completed as of the status line date
Subcontractor Count
Total - The total number of subcontractors enrolled in the project
On Site – Subcontractors with active assignments as of the status line date - i.e., tasks with planned start dates before and end dates after the selected status date
For Effort Entry – Subcontractors who were actually on-site and contributed effort on the status date
Task Count
Total – Total number of last-level tasks in the project Work Breakdown Structure (WBS)
Draft – Tasks that have been created but not yet published
Active – Published tasks that have not yet started (0% progress)
Progress – Tasks that are currently underway
Completed – Tasks marked as 100% complete
The lower pane shows the task details with respect to status lines created for that project:
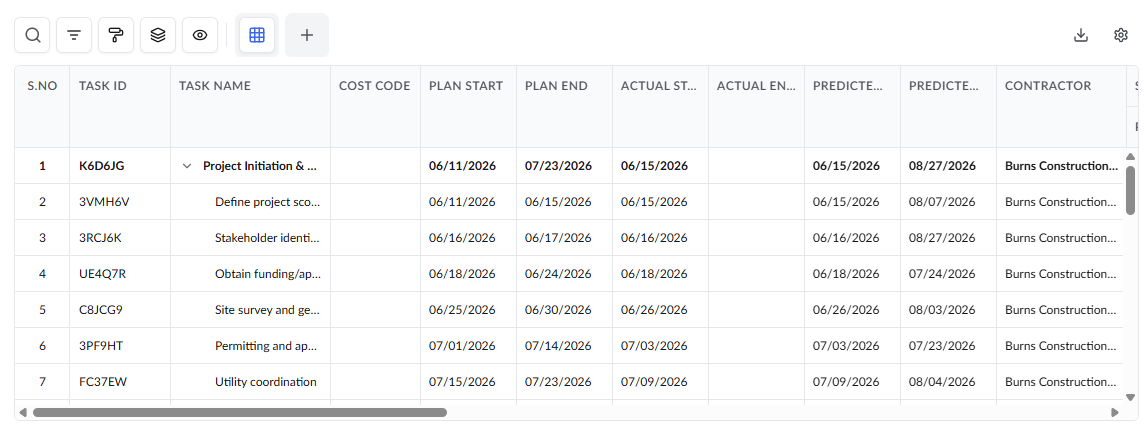
The table shows the following details:
- Task Id - The system-generated alphanumeric code for the task used internally by various modules in the platform
- Task Name- The label of the task/schedule item.
- Cost Code - The unique code to identify the task in various schedule features like look ahead schedule.
- Plan Start - The scheduled commencement date of the task
- Plan End - The completion date of the task
- Actual Start - The real commencement date of the task on the field
- Actual End - The real completion date of the parent-level task is fetched from the date of the completion of the final last-tier item of the task branch in the WBS hierarchical tree structure
- Predicted Start - The anticipated start date calculated from the planned start date and the current progress
- Predicted End - The anticipated end date calculated from the planned start date and the current progress
- Contractor - The contractor company to whom the task item is allotted
Task status based on the status line marker
- Plan% – The percentage of planned progress a task was expected to achieve by the status line date
- Actual% – The percentage of work actually completed as of the status line date
- Difference – The variance between planned progress and actual progress
- Predicted Start - The anticipated start date calculated from the planned start date and the current progress with respect to that status line
- Predicted End - The anticipated end date calculated from the planned start date and the current progress with respect to that status line
Search, Filter, and Sorting Options
- Click the magnifier icon and use the 'Search' box located at the top left to find an entry using any value from the table as search criteria
- Click any column header to sort the rows in ascending or descending order based on that column's data.
- Click the cog wheel icon at the top right to adjust the display density and customize the display and order of the columns. See Customize Columns in List Views.
- The options at the top left allow you to filter the entries, create nested groups of entries, highlight cells and manage personalized and customized views of the table. Use the links below to learn more:
Was this article helpful?
That’s Great!
Thank you for your feedback
Sorry! We couldn't be helpful
Thank you for your feedback
Feedback sent
We appreciate your effort and will try to fix the article