The 'Other' tab of the job cost report details task-wise spending on miscellaneous activities, giving visibility into costs that fall outside standard project categories. You can quickly access structured reports that provide clear visibility into how overhead budgets are utilized. These reports cover a wide range of costs—such as office maintenance, temporary bills, salaries, and temporary accommodation or warehousing—making it easier to stay on top of project finances.
- Cost Insights: Breaks down expenses at the task level to show how funds are being utilized across miscellaneous work.
- Financial Control: Helps monitor unplanned or ad-hoc costs, ensuring accountability and better overall budget management.
To view the miscellaneous cost report
- Ensure that you are in the 'Analytics' screen. If not
- Click the App Launcher button
 in the top-right corner.
 - Select 'Finance' from the dropdown menu.
- Select 'Analytics' on the top and 'Job cost' on the left
- Choose the 'Others' tab to open the miscellaneous cost report
- Click the App Launcher button
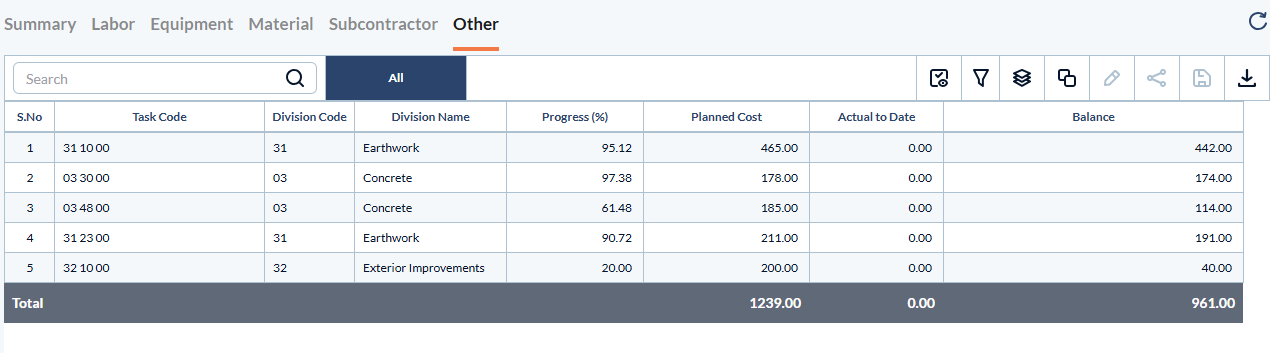
Task Code – A unique identifier assigned to a specific cost item or activity, used to track expenses and performance at a granular level.
Name – The descriptive label of the task.
Division Code – The standardized numerical code of the discipline of work as per the CSI MasterFormat. Applicable only if your company's cost codes are inherited from the CSI MasterFormat.
Division Name – The descriptive name of the discipline of work.
- Progress – The percentage of work completed for the task.
- Planned Cost – The budgeted or estimated cost for completing the task as per the project plan.
- Actual to Date – The cumulative cost incurred for the task from the start of the project up to date.
- Balance – The remaining budget available for the task, calculated as the planned cost minus the actual cost incurred to date.
Search, filter and sort options:
- Use the 'Search' box located at the top left to find any project using any value from the table as search criteria
- Hover over a column header and use the sort icon to sort the table in ascending or descending order of the entries in that column
- Right-click the column header and customize the display and order of the columns as you wish
- The options at the top right allow you to filter the entries, and manage personalized and customized views of the table. Use the links below to learn more about these:
View Groups and Subtotals
- You can get totals and subtotals of numerical data for any selected set of records by grouping and applying nested grouping. Use the
 icon at the top right to organize the data by column headers.
 - The system automatically aggregates relevant numerical values, giving a structured breakdown and a clear view of the grand total distribution. See Group and Organize Items in a List View for more details
Download as Excel Sheet
- Click the
 button at the top right to save a local copy of the list in Excel format for sharing and record-keeping. See Download List Views and Logs in Excel Format for more details.
Was this article helpful?
That’s Great!
Thank you for your feedback
Sorry! We couldn't be helpful
Thank you for your feedback
Feedback sent
We appreciate your effort and will try to fix the article