Linarc provides a centralized log for all recurring cost payment history. This log serves as an audit trail, helping finance teams track recurring expenses over time and ensure alignment with the original cost configurations.
To view recurring cost logs
- Ensure you are on the 'Logs' screen within the 'Recurring Cost' module of the project. If not:
- Click the main menu at the top-left
- Click 'Recurring Cost' under the 'Finance' menu and click 'History' from the left
The list view shows the approved recurring cost logs.
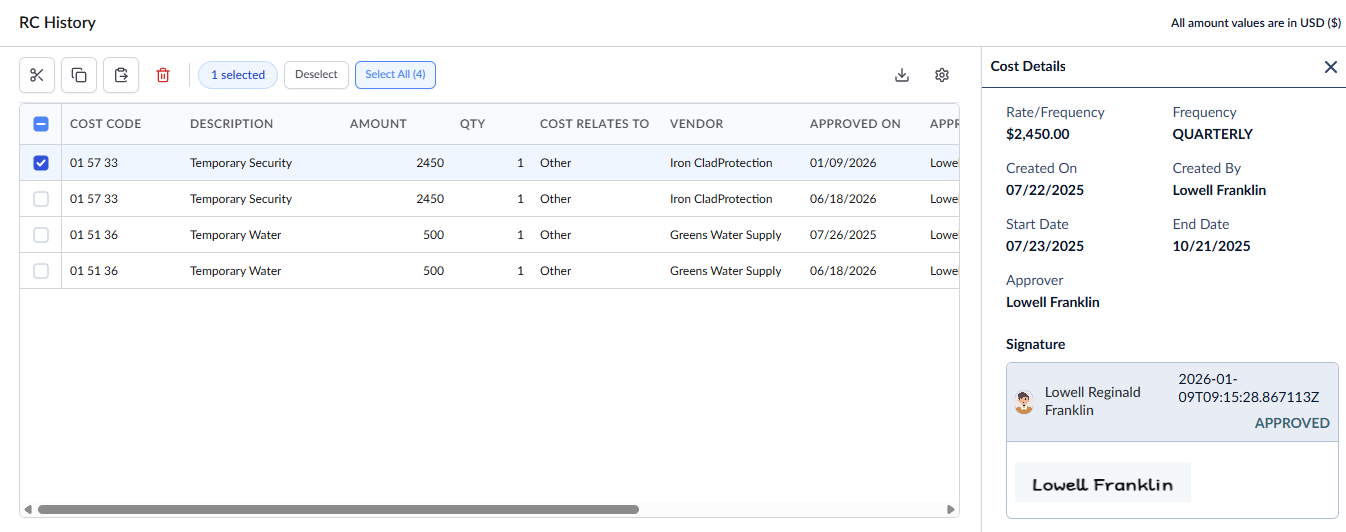
- Cost code - The unique task code associated with the category/task.
- Description -The label of the task
- Amount - The estimated cost value for each recurring instance.
- Cost Relates To - The category the cost applies to. The permitted values are Material, Other, and Overhead
- Vendor - The name of the vendor or supplier associated with the recurring cost.
- Approved By - The designated individual responsible for reviewing and approving cost requests associated with this entry.
- Approved On - The date on which the recurring cost entry was approved.
- Updated On - The system-generated date on which the recurring cost entry was updated.
- Created By - The name of the user who edited the recurring cost configuration.
- Status - The current state of the recurring cost entry.
Search, Filter, and Sorting Options
- Click the magnifier icon and use the 'Search' box located at the top left to find an entry using any value from the table as search criteria
- Click any column header to sort the rows in ascending or descending order based on that column's data.
- Click the cog wheel icon at the top right to adjust the display density and customize the display and order of the columns. See Customize Columns in List Views.
- The options at the top left allow you to filter the entries, create nested groups of entries, highlight cells and manage personalized and customized views of the table. Use the links below to learn more:
- Get totals and subtotals of numerical data for any selected set of records by grouping and applying nested grouping.
- Use the
 icon at the top right to organize the data by column headers. The system automatically aggregates relevant numerical values, giving a structured breakdown and a clear view of the grand total distribution. See Group and Organize Items in a List View
for more details
icon at the top right to organize the data by column headers. The system automatically aggregates relevant numerical values, giving a structured breakdown and a clear view of the grand total distribution. See Group and Organize Items in a List View
for more details
- Click the 'Download' icon at the top right to save a local copy of the list in Excel format for sharing and record-keeping. See Download List Views and Logs in Excel Format for more details
Was this article helpful?
That’s Great!
Thank you for your feedback
Sorry! We couldn't be helpful
Thank you for your feedback
Feedback sent
We appreciate your effort and will try to fix the article